import sys
if '..' not in sys.path:
    sys.path.append('..')
import tensorflow as tf
from ultrayolo import YoloV3, datasets
from ultrayolo.helpers import draw
from pathlib import Path
import numpy as np
import logging

from matplotlib import patches
import matplotlib.pyplot as plt
Predict using a custom Model
The classes contained in the dataset
classes_dict = datasets.load_classes('./custom_classes.txt', True)
target_shape = (512, 512, 3)
max_objects = 100
num_classes = len(classes_dict)
print(f'number of classes {num_classes}')
classes_dict
number of classes 5
{0: 'book',
 1: 'bus',
 2: 'car',
 3: 'motorcycle',
 4: 'vehicle registration plate'}
model = YoloV3(target_shape, max_objects,
               num_classes=num_classes, score_threshold=0.7, iou_threshold=0.7,
               training=False, backbone='DarkNet')
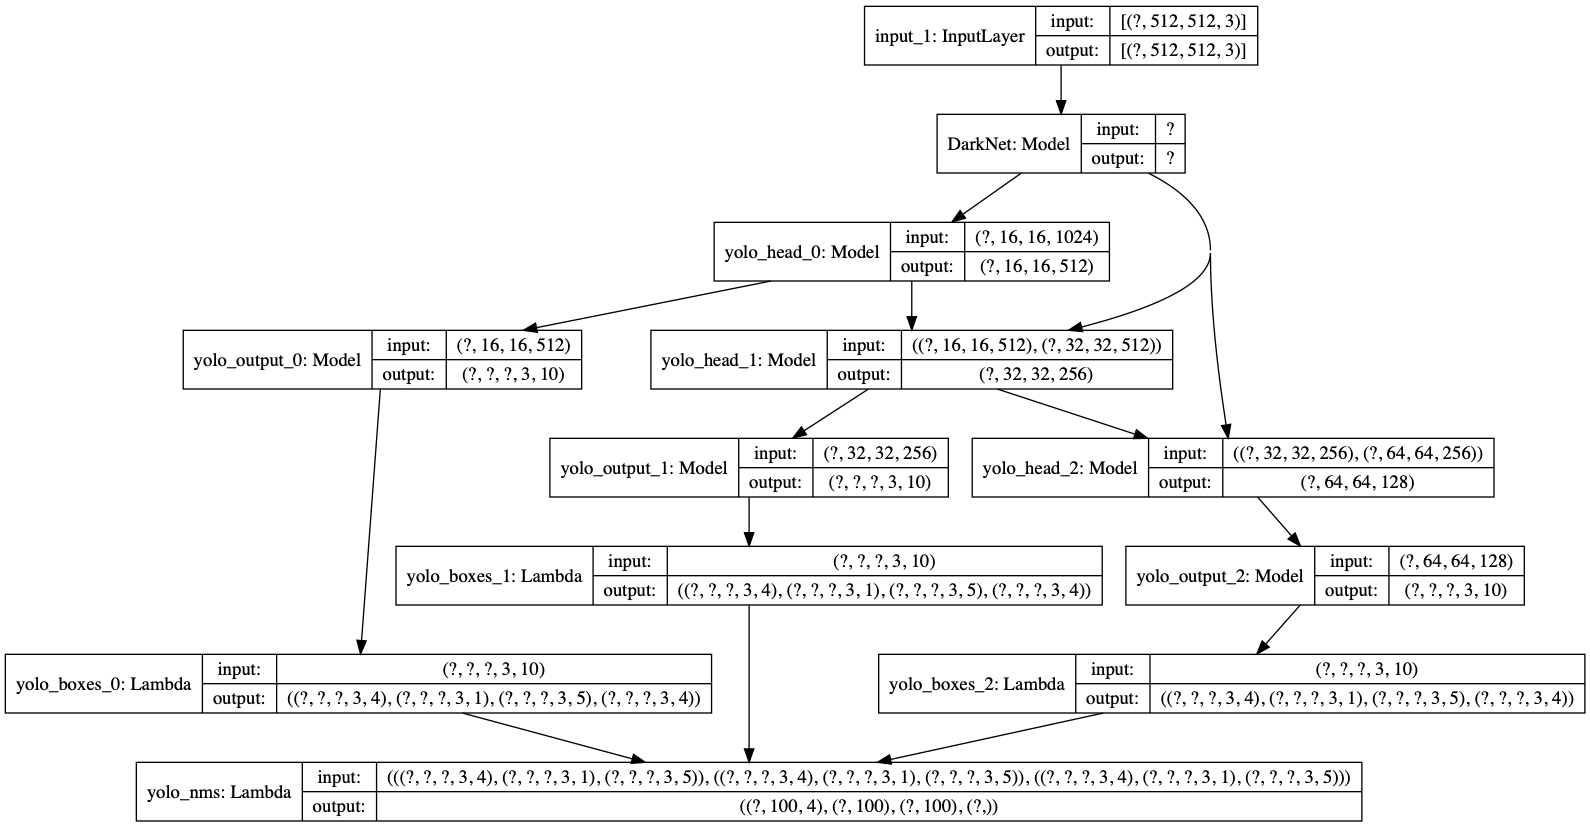
tf.keras.utils.plot_model(model.model, show_shapes=True)

Load the weights
load a custom model from here
w_path = Path('./weights.117-9.932.h5')
model.model.load_weights(str(w_path))
# model.load_weights(w_path)
Predict
we predict the objects using an image from the web. You can try with your.
Download an image
img = datasets.open_image('https://c8.staticflickr.com/4/3901/14855908765_8bdda9130b_z.jpg')
# img = datasets.open_image('https://lh6.googleusercontent.com/proxy/Jo961aR6HemjY-D0TKiVEkVlI7b84uTkfJHSFBCz4UN2maJidjYVznbPrxDpRDd6wlbqn80ZmP_ohdCPkE9syrVJPIjiYvgbo9ovRAArlFC_9Sm4V3NZi--R')
img_pad = datasets.pad_to_fixed_size(img, target_shape)
img_resized = datasets.resize(img, target_shape)
#preprocess the image
x = np.divide(img_pad, 255.)
x = np.expand_dims(x, 0)
x.shape
(1, 512, 512, 3)
Perform the prediction
boxes, scores, classes, sel = model.predict(x)
print(f'found {sel[0]} objects')
found 3 objects
Uncomment the cells below to see what the model returns
boxes[:,:sel[0],:]
scores
classes
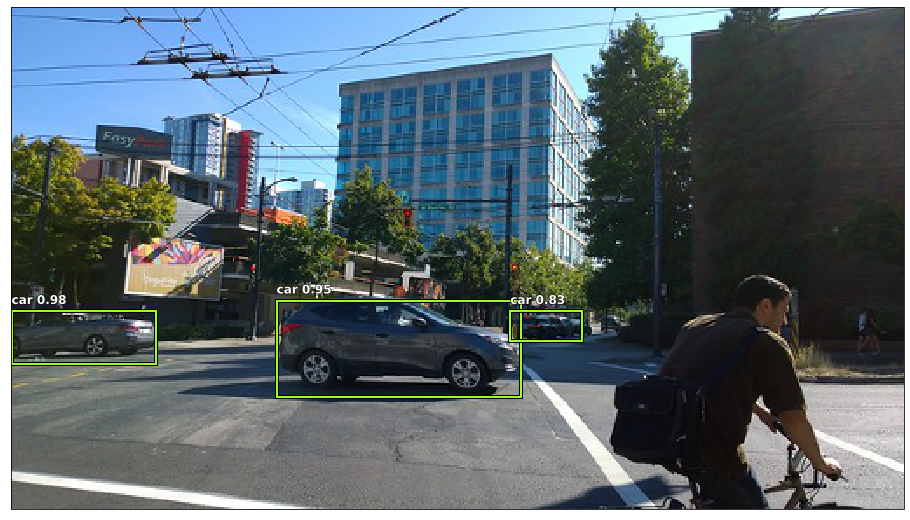
Show the image with the discovered objects
ax = draw.show_img(img_resized, figsize=(16,10))
for i,b in enumerate(boxes[0,:sel[0]]):
    draw.rect(ax, b, color='#9cff1d')
    name_score = f'{classes_dict[classes[0, i]]} {str(round(scores[0,i],2))}'
    draw.text(ax, b[:2], name_score, sz=12)
    print(classes_dict[classes[0, i]], scores[0,i])

plt.show()
car 0.97570795
car 0.9543877
car 0.83372337
